Using your smartphone to study the ionosphere
Among the amazing capabilities of your mobile phone is the ability to determine your location with impressive precision. This is accomplished using signals from Global Navigation Satellite Systems (GNSS), such as GPS. However, the ionized outer atmosphere of the Earth (the ionosphere) disrupts these signals. This ionospheric error is corrected through clever processing inside your phone, as explained in this short video.
The error that is removed provides a valuable scientific diagnostic – namely, it provides a precise measure of the total integrated plasma density between the GPS satellite (at 20,000 km altitude) and your receiver (on the ground). This quantity, called the "Total Electron Content" (or TEC), is used by ionospheric scientists to create images of the ionosphere. But the signals used are typically from permanent receivers spread across the globe. We seek to add ionospheric data from your personal smartphone to this sensor network. The increase in information would provide an enormous benefit to ionospheric and space weather research, as illustrated in the figure below.
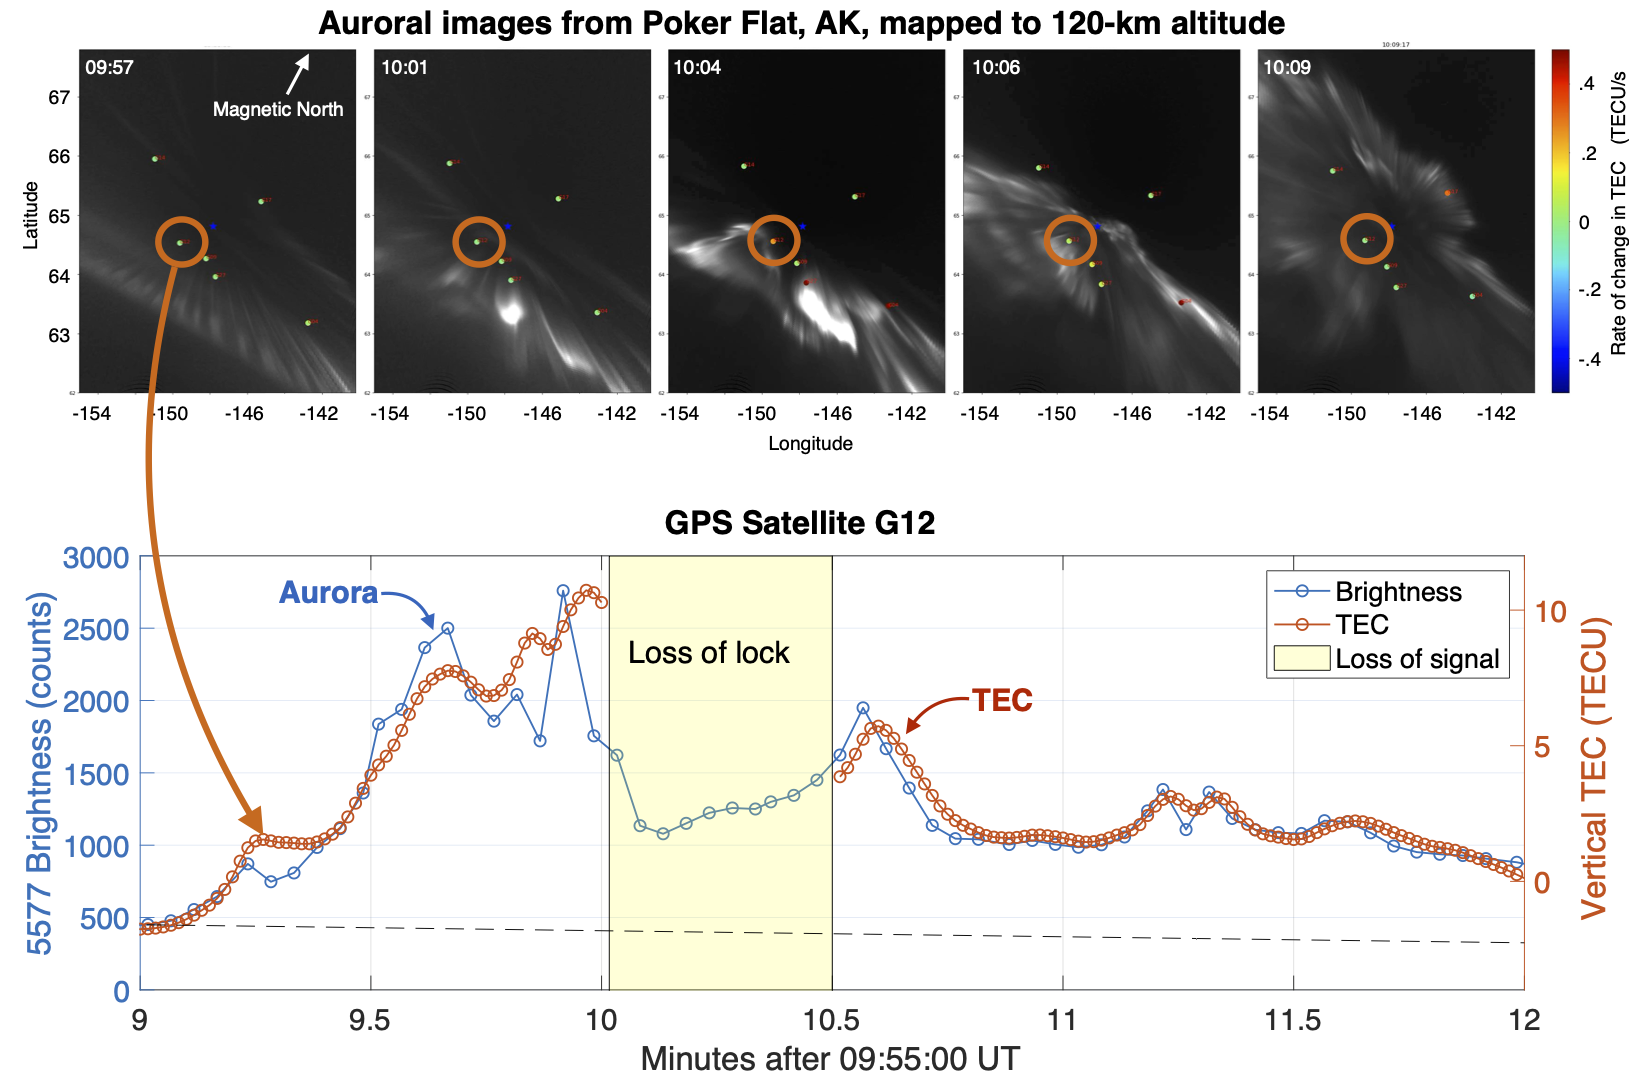 Top row: Images of an auroral substorm from Poker Flat, AK. Circles show the location of GPS satellites within the field of view, acquired by a permanent receiver in Fairbanks. Colors indicate the time rate of change of the TEC. Bottom panel: Plot of the total TEC produced by the aurora (red curve) computed using signals from GPS satellite G12. The blue curve is the brightness of the aurora in the same position. The yellow region marks the interval when the receiver lost lock on the signal due to the aurora.
We will soon be soliciting citizen scientist volunteers to help us develop this concept. Stay tuned for more information!
The Mysterious Green Streaks Under STEVE
STEVE (Strong Thermal Emission Velocity Enhancement) is an atmospheric optical phenomenon caused by supersonic plasma jets flowing in the upper atmosphere, above 100 km. The dominant feature is a whitish mauve arc extending in the magnetic east-west direction. This arc is often accompanied by regions of green emissions, which often appear in periodically spaced columns resembling a "picket fence." The similarity to auroral rays caused many to assume a similar process was at play. However, the columns are often accompanied by smaller ephemeral features that are very> non-aurora like. A paper published in March 2020 examines a particularly intriguing apparition: a narrow streak commonly appearing below, and sometimes connected to, the vertical columns above. Several examples acquired by citizen scientists are shown below.
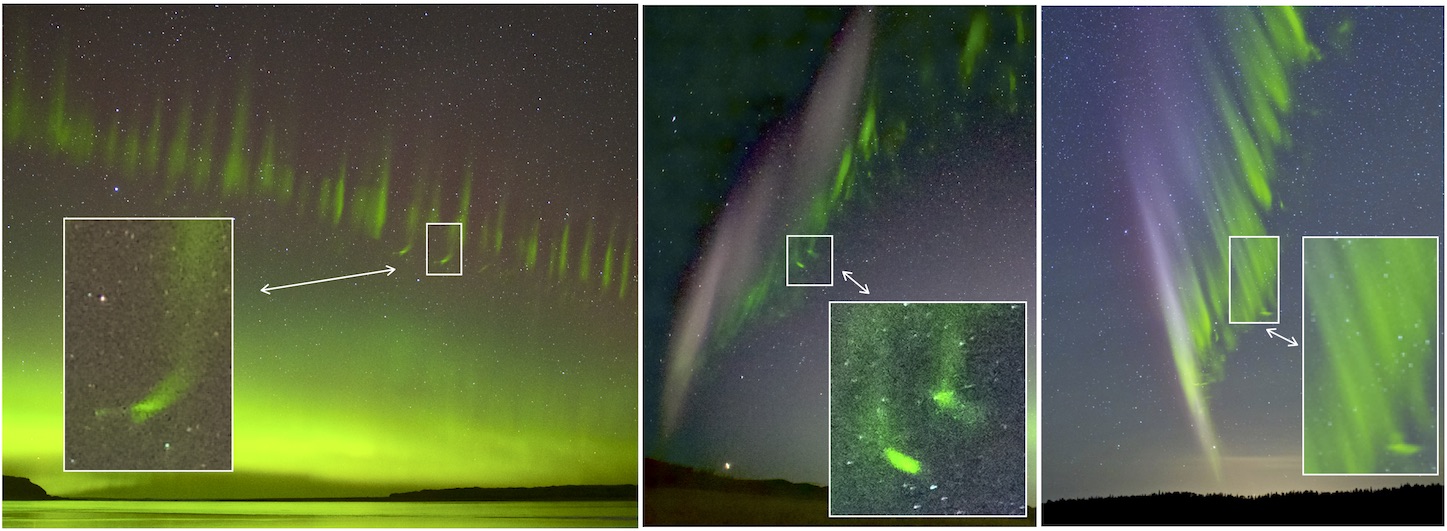 Photo credits (left to right): Stephen Voss, Alexei Chernenkoff, Shawn Malone.
When viewed as a time sequence, the streaks are found to race directly toward the main STEVE arc at speeds of 0.5 km/s. An example sequence is shown below.
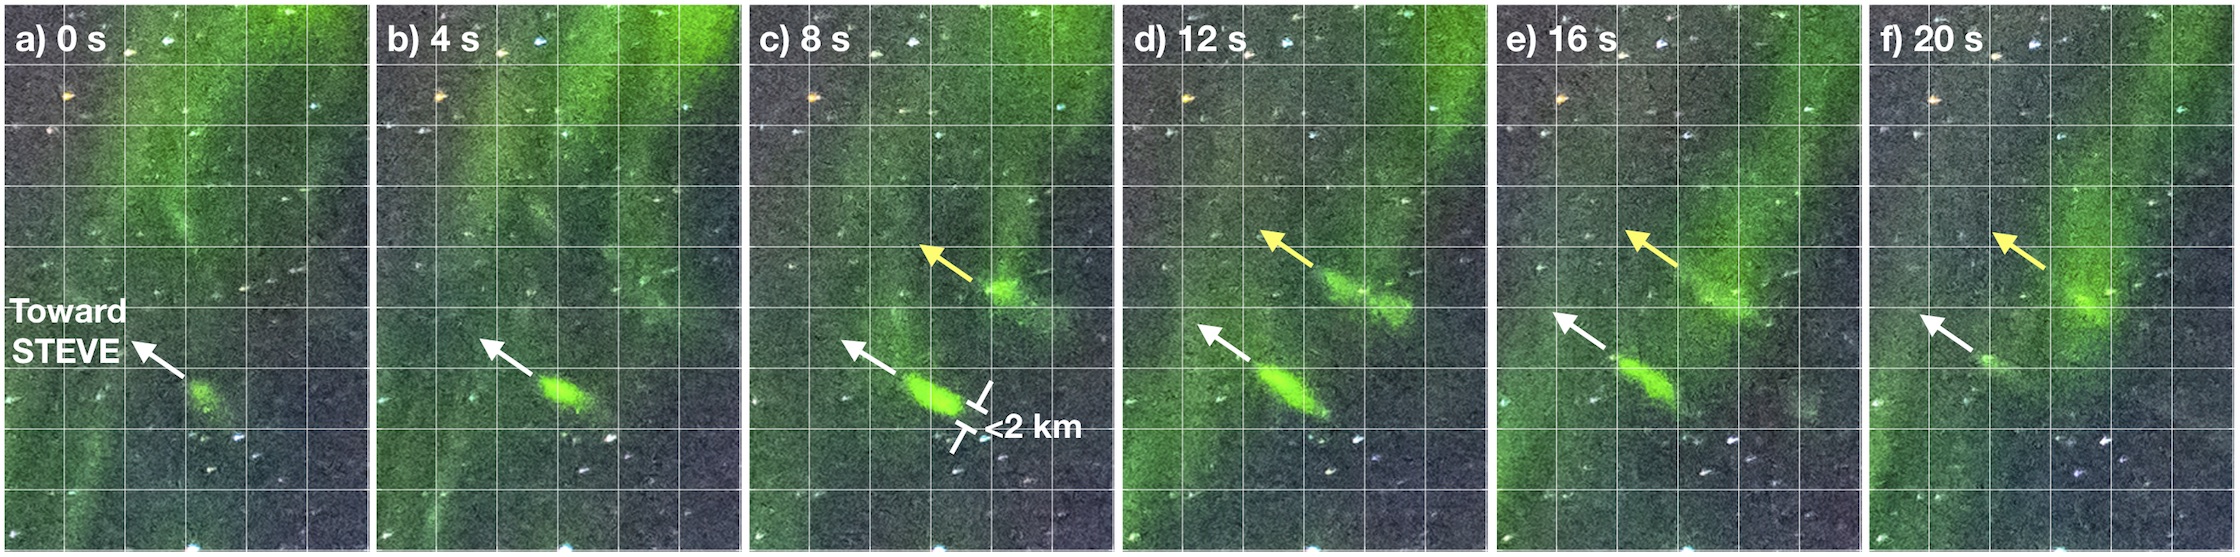 Photo credit: Alexei Chernenkoff.
STEVE is optical manifestation of extreme electromagnetic fields applied to the ionospheric plasma by the magnetosphre. These unfamiliar emission features described in our work are thought to be produced by turbulent heating of the electron gas in the vicinity of STEVE. Citizen scientists have played a crucial role in this research, and will continue to do so.
Further Reading
Semeter, J., M. HunnekuhlJ., E. MacDonald, M. Hirsch, N. Zeller, A. Chernenkoff, and J. Wang, The Mysterious Green Streaks Under STEVE , DOI:10.1002/essoar.10502878.1, submitted to AGU Advances , March 27, 2020.
MacDonald, E., Conde, M., Kosar, B, Lynch, K., Semeter, J., Zeller, N., What else can citizen science and ’amateur’ observations reveal about STEVE?, Abstract SM43A-09, presented at the AGU Fall Meeting, 2018.
Semeter, J., et a., Critical analysis of STEVE fine structure: New constraints derived from high-resolution photogrammetry, Abstract SM11C-3297, presented at the AGU Fall Meeting, 2019.
Atmosphere as Particle Detector
September 2019 — The aurora provides both beauty and scientific insight. Auroral light is caused by energetic electrons streaming into the atmosphere. The energy of these particles is revealed in both the altitude and the color of the aurora. In this way, dancing auroral lights represent a projection of particle acceleration processes operating deep in the Earth's magnetosphere.
Using coordinated observations by ground-based cameras and space-based particle detectors, we were able to identify a new class of aurora caused by particle precipitation at the edges of the van Allen radiation belt The radiation belts are a hazardous concentric band of charged particles encircling the Earth. During geomagnetic storms, these belts intermingle with plasma waves, causing the particles to be released into the atmosphere, resulting in a band of streaky auroral features that act as a fingerprint for this mechanism.
When the Van Allen belts undulate in shape and size — which they do in response to incoming radiation from the Sun as well as changes from Earth below — they can envelop satellites in unexpected radiation. The new discovery will help us better track the edges of the belts — and the more we know about how the belts are changing, the more we can mitigate such effects.
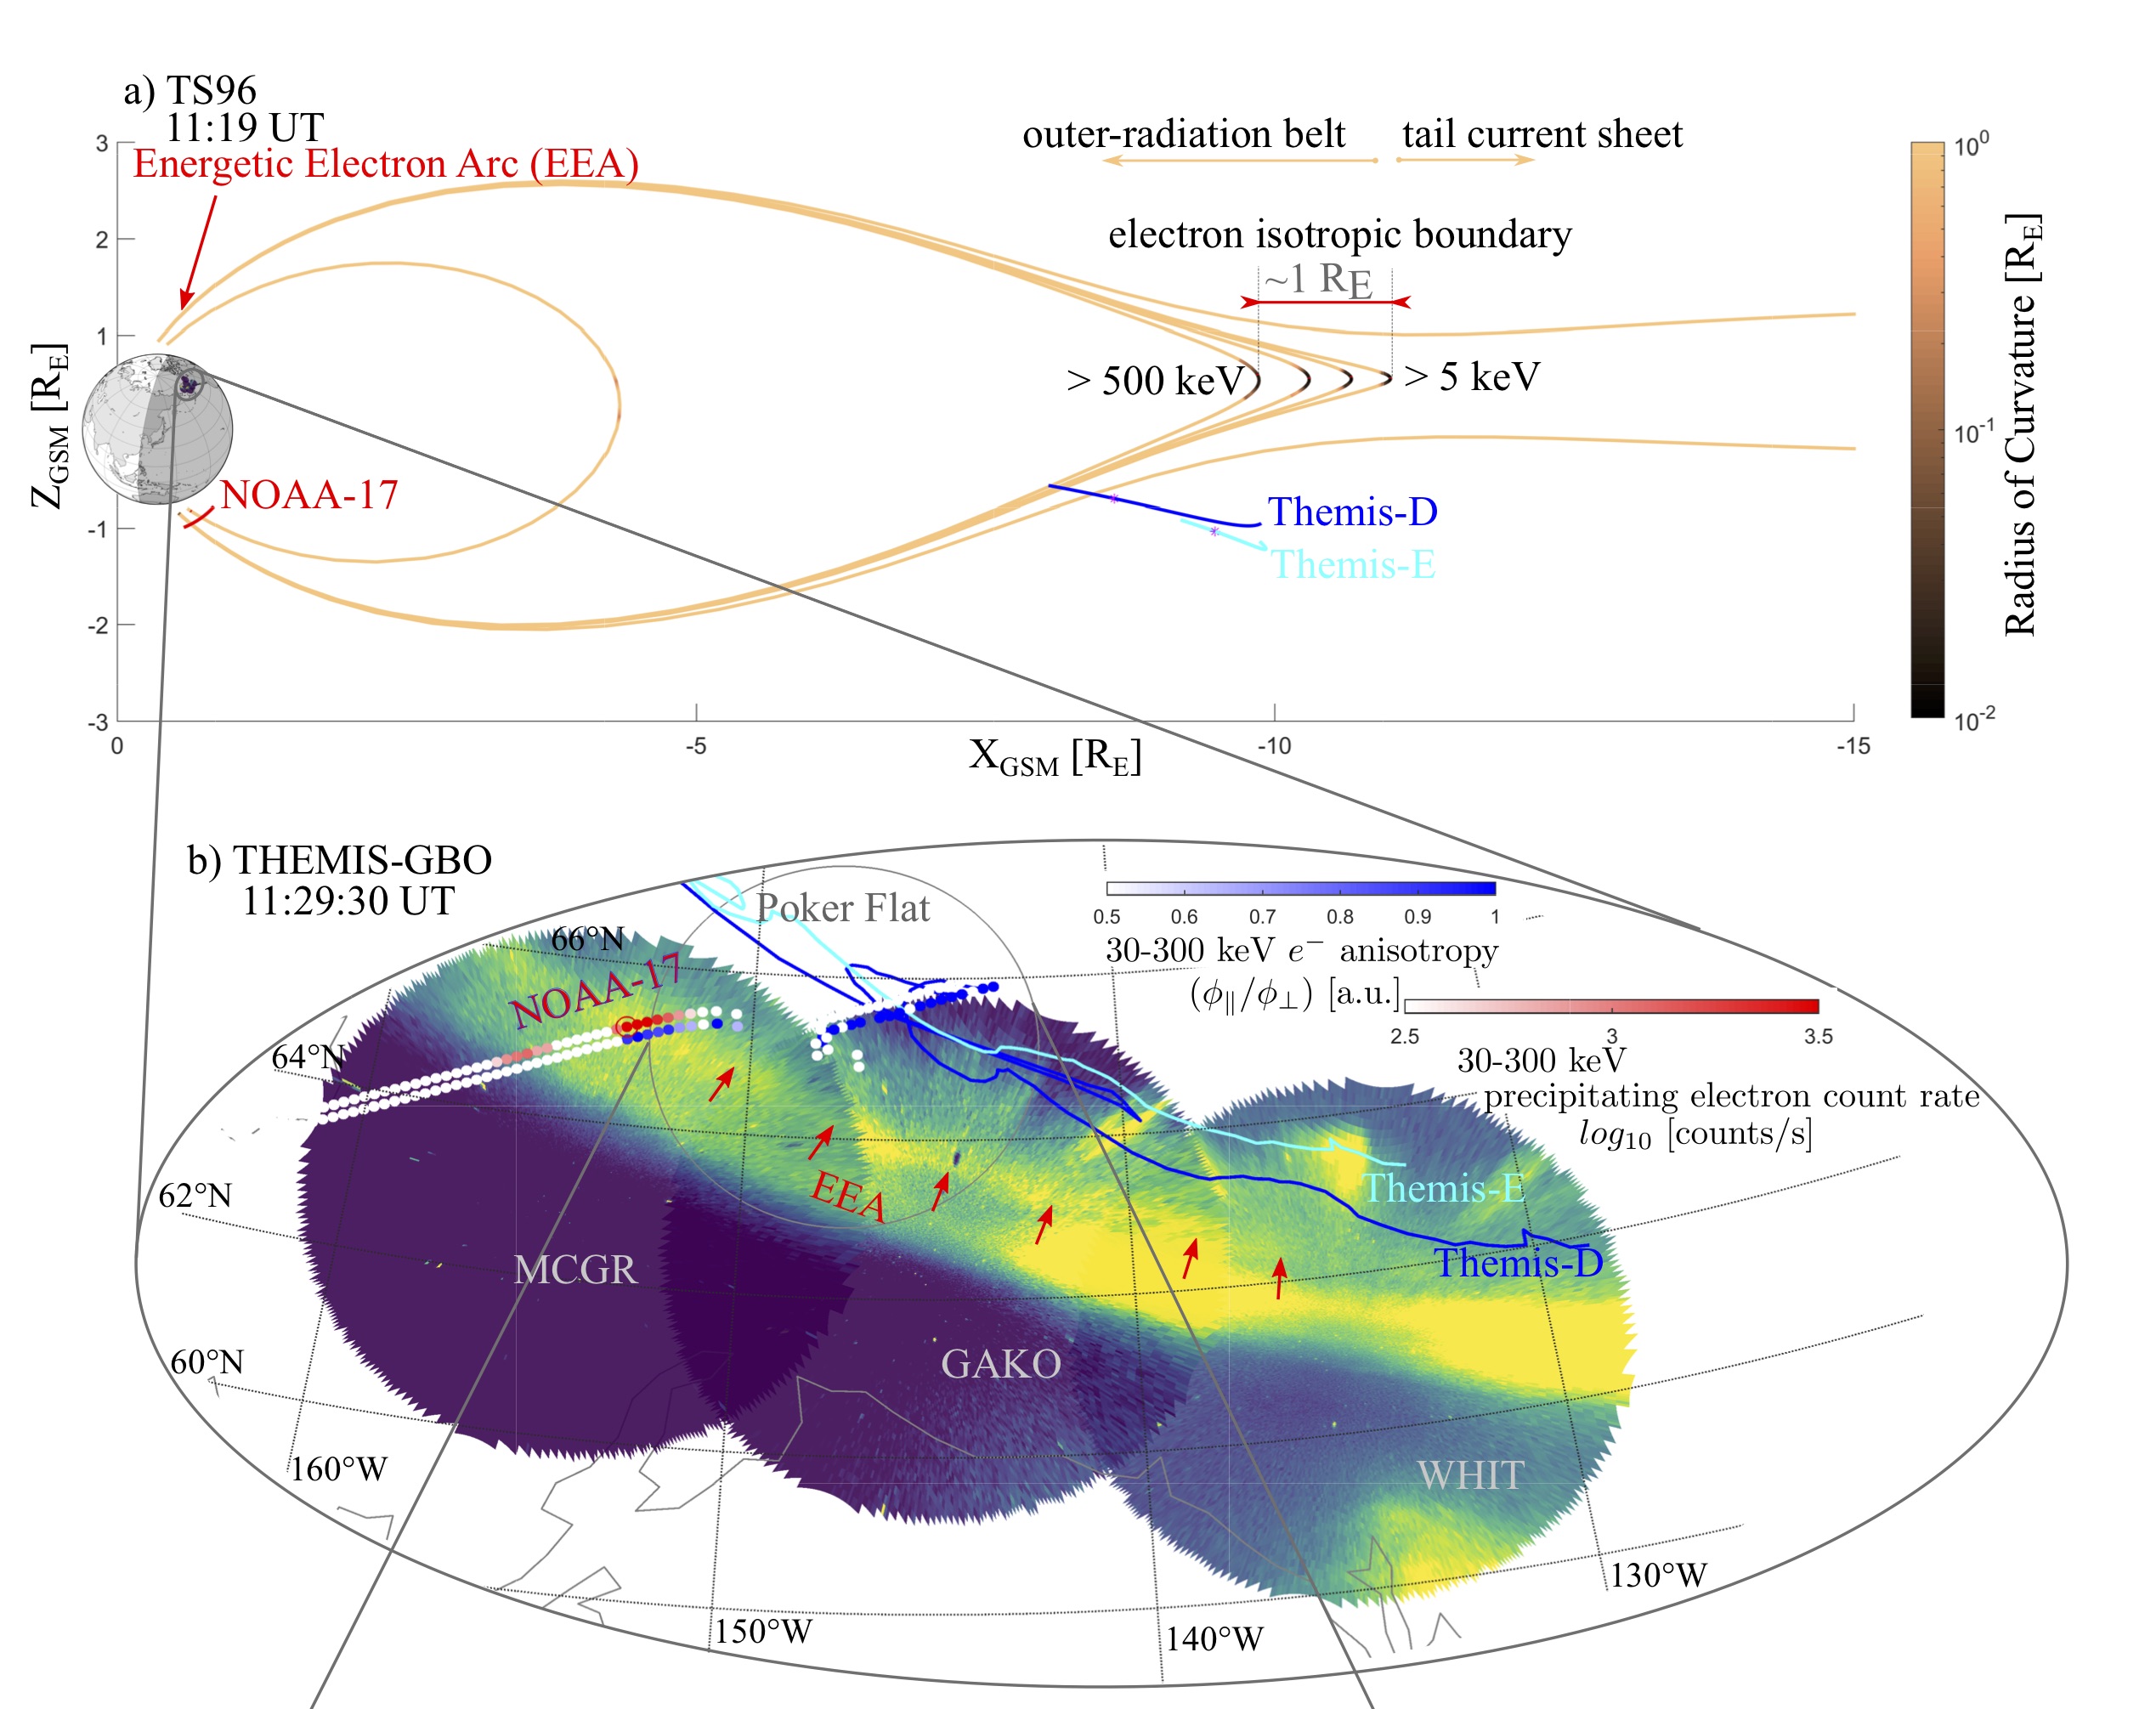 Top: Schematic illustration of the Earth's magnetosphere. An interaction between the outer van Allen radiation belt and the stretched tail of the magetosphere causes precipitation of electrons with energies approachhing 500~keV to precipitating ino the atmosphere. Bottom: The precipiation produces a band of low altitude luminosity that serves as a "fingerprint" for this magnetotail interaction. Results are verified by particle detectors on orbiting NASA and NOAA spacecraft.
Further Reading
Sivadas, N., Semeter, J., Nishimura, Y. T., and Mrak, S. ( 2019). Optical signatures of the outer radiation belt boundary. Geophysical Research Letters, 46, 8588? 8596. https://doi.org/10.1029/2019GL083908.
Sivadas, N., J. Semeter, and T. Nishimura, “Simultaneous measurements of substorm-related electron energization in the ionosphere and the plasma sheet,” J. Geophys. Res. 122, 10,528-10,547 2017.
March 2020 — ANDESITE (Ad-Hoc Network Demonstration for Extended Satellite-Based Inquiry and Other Team Endeavors), is a 6U CubeSat mission developed by the Boston University Center for Space Physics.
Small-scale plasma phenomena, on the order of hundreds of meter, in the aurora are difficult to resolve with conventional satellite based measurements. Boston University will launch the ANDESITE mission, that allows for a spatial and temporal resolution at this scale by flying a formation of picosatellites with on-board three-axis magnetometers. with local measurements spaced only a few hundred meters apart, they can differentiate current density distributions in auroral arcs with less constraints on the assumed geometries. These measurements then allow for a better view into the nature of current filaments and vortex structures as seen by high-resolution ground based optical cameras.
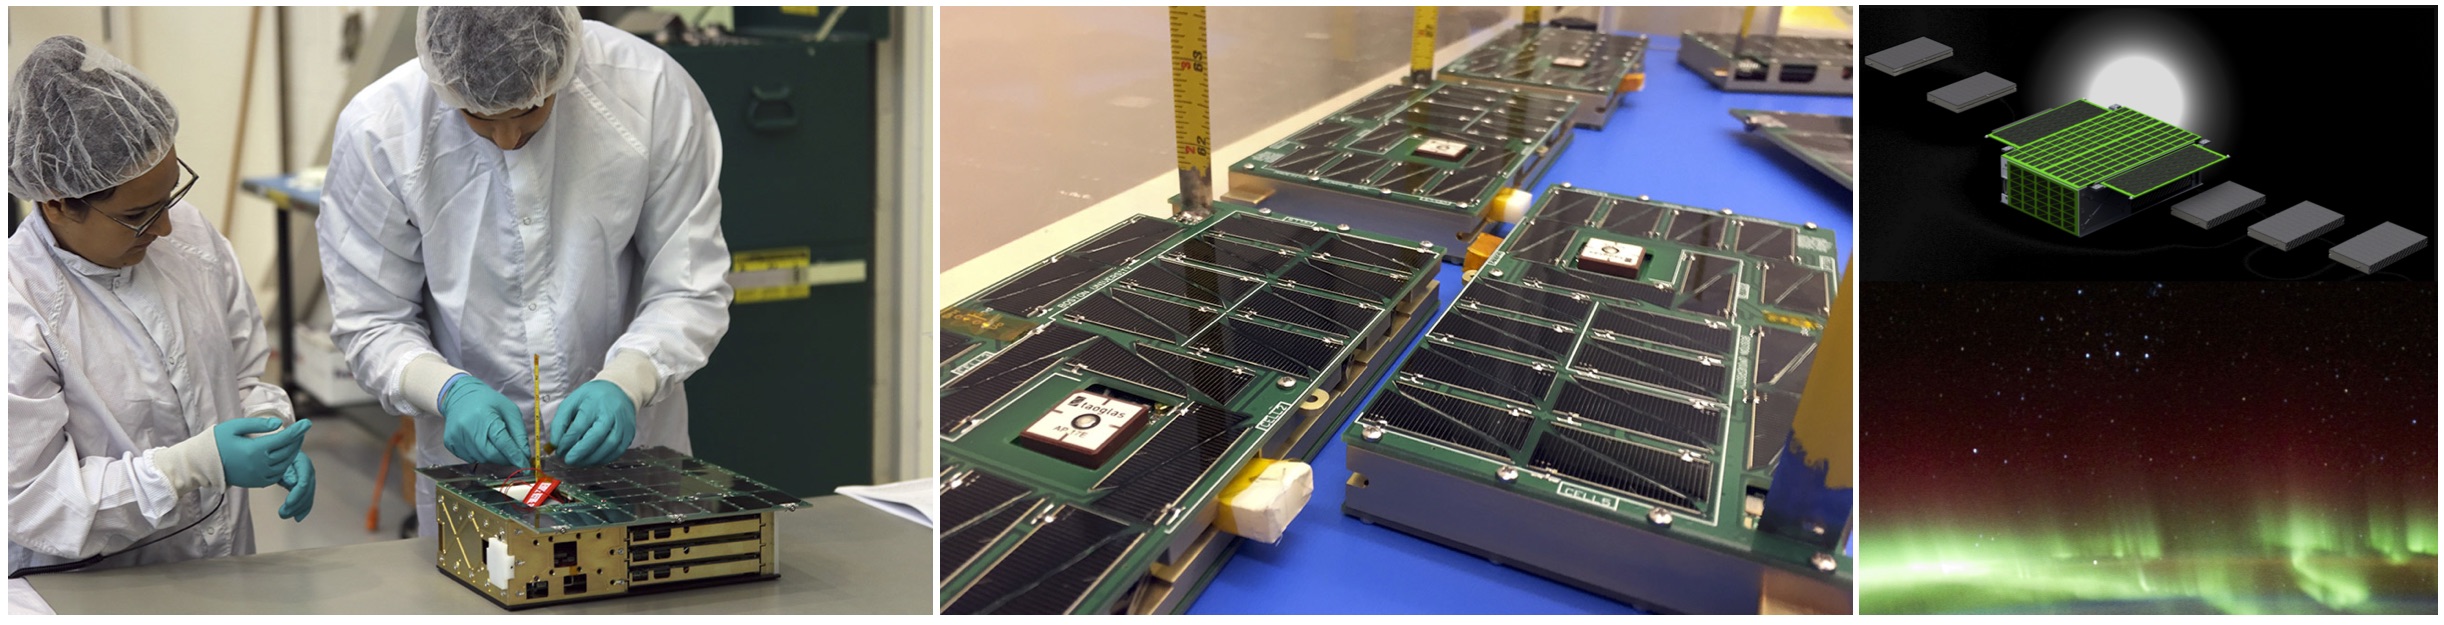
ANDESITE is a 6U CubeSat that deploys several smaller “pico-satellites” that each have their own self-contained scientific magnetometer, power system and radio communication system. The satellites collect data in a loosely held swarm, relaying the data back to the main spacecraft and down to the Earth through the GlobalStar satellite phone network.
ANDESITE will rely on widely accessible space-grade hardware developed around the CubeSat concept. ANDESITE seeks to use this technology to design a set of interacting miniature Sensor Nodes, for high-resolution sensing of space and atmospheric environments. A network manager called the Mule will integrate a Command and Data Handling Unit (C&DH) running Android OS to manage the constellation and data.
For more information
Leveraging the Planet Labs satellite constellation to study the aurora.
May 2019 — Planet Labs Inc. is the world's largest satellite constellation operator. A partnership between BU and Planet has enabled us to use their on board magnetic field sensors to improve our understanding of the electric currents that power the aurora. Their constellations are in sun-synchronous orbit, and designed to provide high-cadence, high resolution images of the daylit Earth. The rapid revisit rate make this configuration particularly useful for studying how auroral currents change over short time scales. This is illustrated in the image samples below, which show magnetic deflections measured by successive satellite passees superimposed on wide-field images of the aurora recorded by a ground-based camera.
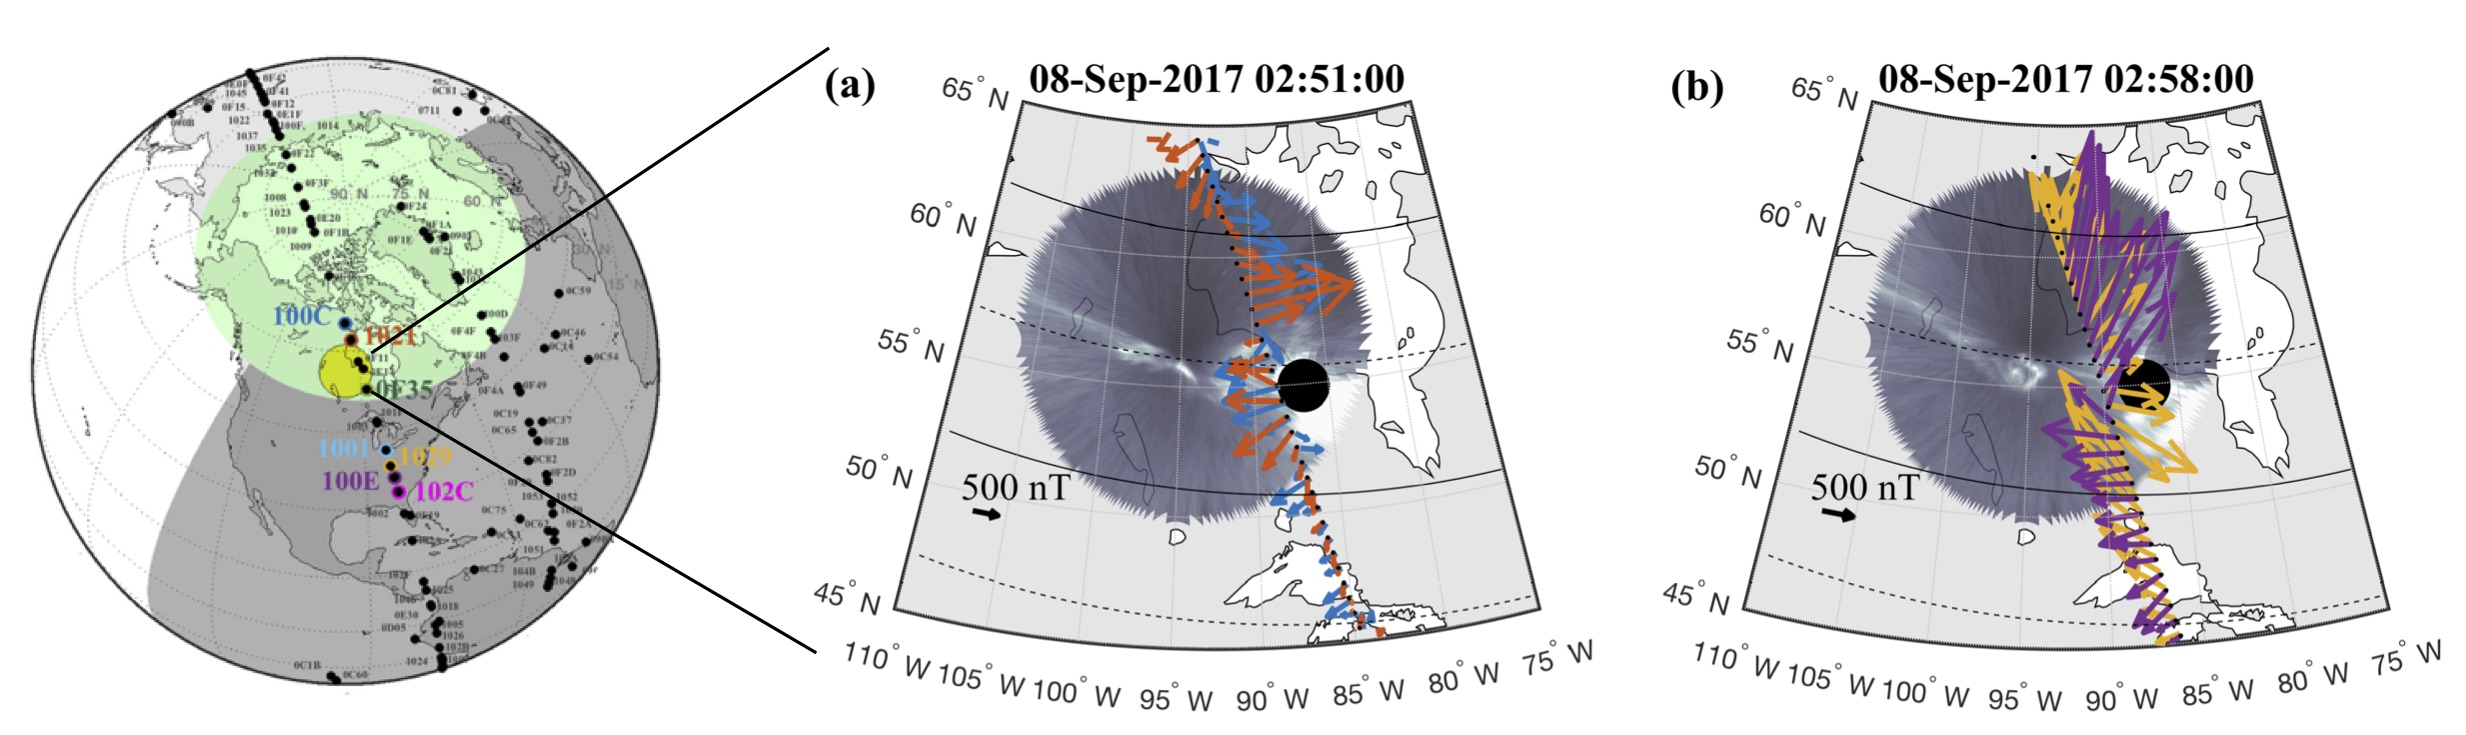 The left panel shows the the Planet Labs satellite constellation as of mid-2017. The other panels show magnetic field deflections (arrows) for successive satellite crossings of an active auroral arc over southern Canada.
Further Reading
Parham, J. B., Beukelaers, V., Leung, L., Mason, J., Walsh, B., and Semeter, J. ( 2019). Leveraging commercial cubesat constellations for auroral science: A case study. Journal of Geophysical Research: Space Physics, 124, 3487? 3500. https://doi.org/10.1029/2018JA025966
Parham, J., Semeter, J., and B. Walsh, Networked Small Satellite Magnetometers for Auroral Plasma Science, J. of Small Satellites, Vol. 8, No. 1, pp. 801?814, 2019.
Sunspots create giant rings in the ionosphere during the 2017 solar eclipse
May 2018 — Our planet is surrounded by a layer of ionized gas which is created by X-ray and extreme ultraviolet (EUV) radiation from the sun. During the August 2017 total solar eclipes the source of the ionosphere was progressively blocked by the lunar transit. The expected response of the ionosphere was a smooth decrease in plasma density, followed by a smooth return.
By analyzing the signals received from a massive network of GPS receivers, we created images of ionospheric variations caued by the eclipse as it crossed the continental U.S. The time sequence of images revealed ring-shaped patterns in the ionospheric modulation (left panel below) that tracked the eclipse.
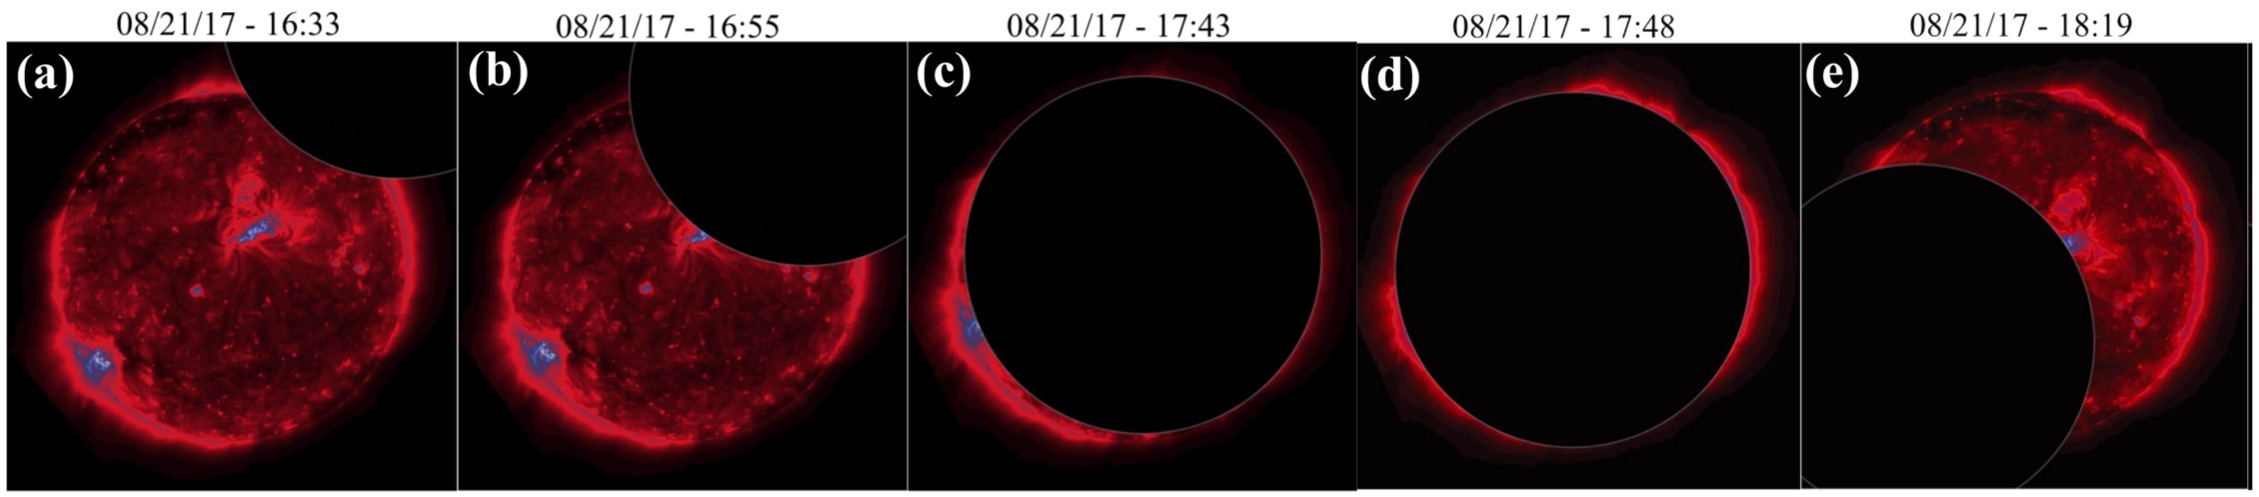
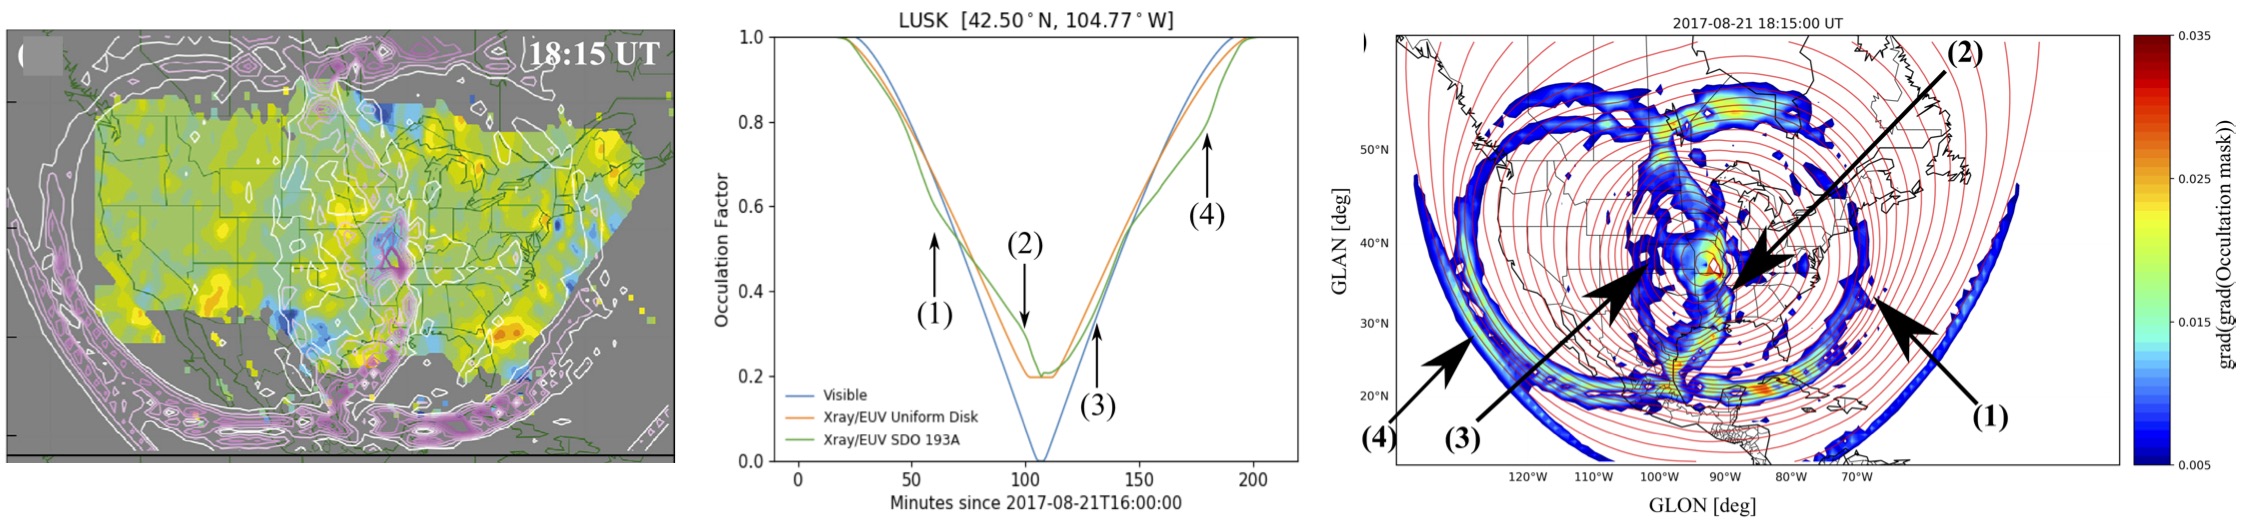 To understand this, we used measurements from the Solar Dynamics Observatory (SDO) to model the ionospheric source function as the solar disk was occluded. This function was not smooth, but rather showed two sharp transitions caused by two active regions on the sun (middle panel), which are visible in blue the SDO imagery above. When mapped to the Earth, these bumps manifest as modulations to the ionospheric source function, that appear as two interlocking rings (right panel) which match the observed density variations. This result provides insight into how Earth's atmosphere is impacted by sunspot activity, as well as providing an accurate baseline for studying other secondary effects expected from an eclipse sucha s atmospheric waves.
Further Reading
Mrak, S., Semeter, J. L., Drob, D., and Huba, J. D. (2018). Direct EUV/X‐ray modulation of the ionosphere during the August 2017 total solar eclipse.Geophysical Research Letters, 45, 3820– 3828.
Mrak, S., Semeter, J., Nishimura, Y., Hirsch, M., and Sivadas, N. (2018). Coincidental TID production by tropospheric weather during the August 2017 total solar eclipse. Geophysical Research Letters, 45, 11,903– 11,911.